

THETA Technical Analysis
- Buy: TP $1.45, SL $1.02
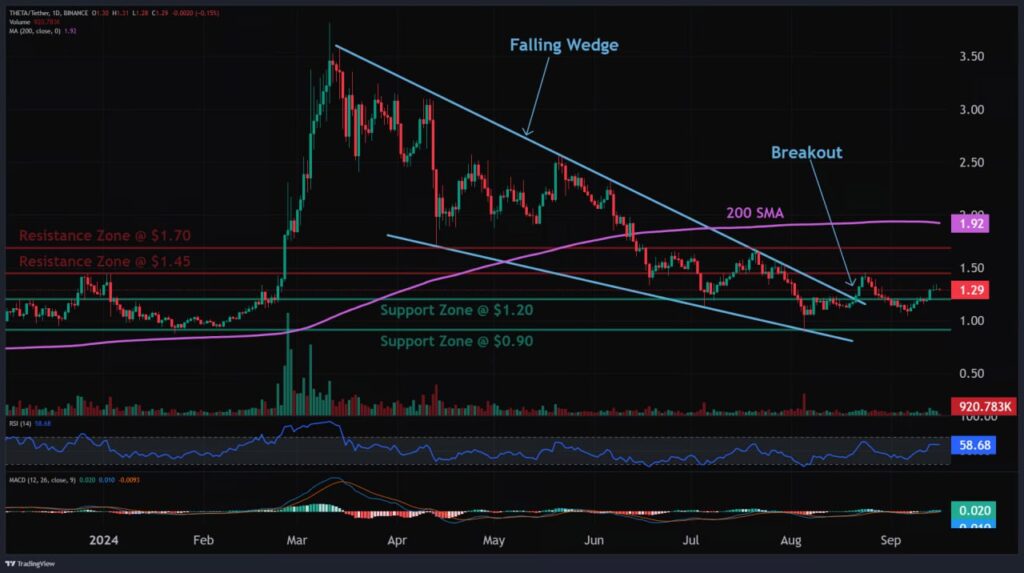
- Trade setup: Price is in a downtrend, but showing improvements. It had a bullish breakout from a Falling Wedge pattern, reaching the target of $1.45 with a +20% gain. Swing Traders can look for a pullback near the $1.20 support for another entry, with +20% upside potential to $1.45. Stop Loss at $1.02. This is a riskier trade setup as it’s a trend reversal setup, going against the overall downtrend.
- Pattern: Price is approaching support, where it could pause or reverse its recent decline. Once price breaks below support, it can fall to the next support level.
- Trend: Short-term trend is up, medium-term and long-term trends are strongly down.
- Momentum: Bullish MACD signal. Price is neither overbought nor oversold (RSI 30-70).
- Support: $1.20, then $0.90
- Resistance: $1.45, then $1.90
Summary: THETA has shown a breakout from a Falling Wedge and reached a target of $1.45. Swing traders may look for a pullback to $1.20 for another entry opportunity, but the trade carries higher risk due to the ongoing downtrend.